Evapotranspiration: What It Is and How It Is Helpful
by Bruce Smith | Updated: 06/08/2017 | Comments: 3
Blog Topics
Area / Application


Product Category


Corporate / News
Search the Blog
Subscribe to the Blog
Set up your preferences for receiving email notifications when new blog articles are posted that match your areas of interest.
Suggest an Article
Is there a topic you would like to learn more about? Let us know. Please be as specific as possible.
Have you ever heard someone mention "ET" and wondered what it meant? Assuming the person wasn’t talking about extra-terrestrials or Entertainment Tonight, the conversation was probably about evapotranspiration. Evapotranspiration (or "ET") is the water lost through plant transpiration and soil and plant evaporation. The images below help explain what ET is and how it occurs.
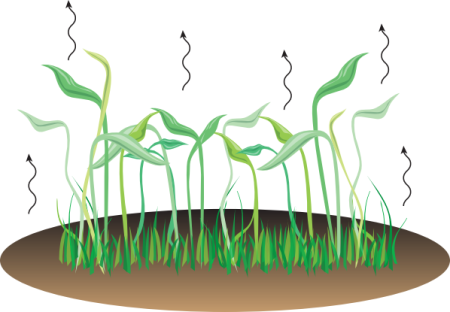
Evapotranspiration (ET) is the combination of evaporation and transpiration. Evaporation is water movement from wet soil and leaf surfaces. Transpiration is water movement through the plant. This water movement helps move vital nutrients through the plant.
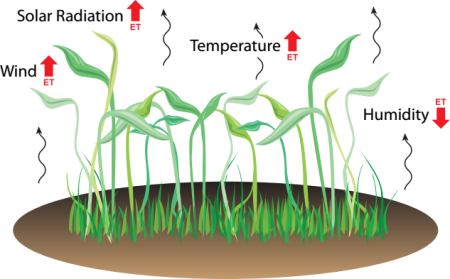
Evapotranspiration (ET) is an energy-driven process. ET increases with temperature, solar radiation, and wind. ET decreases with increasing humidity.
So, how exactly is knowing the ET helpful? You can use ET to determine when and how much irrigation water is needed. A common use is with turf grass irrigation. As an example, if your irrigation system applies 0.5 inches of water during one irrigation event, with no rainfall and an ET loss value for 2 days in a row of 0.25 inches, you would need to irrigate after these 2 days.
Calculating Reference Evapotranspiration
With a few weather measurements and site location information, you can use a mathematical formula to estimate the “Reference Evapotranspiration.”
Note: Rain totals are not part of the Reference Evapotranspiration, and they should be compensated for as necessary. For example, a rain total of 0.15 inches in one day with an ET value of 0.25 inches for the same day would be a net loss of 0.10 inches.
When using the Reference Evapotranspiration formula, these are the weather measurements you need and their importance:
- Solar Radiation – Constitutes up to 80% of the equation depending on conditions.
- Air Temperature – Ties for 2nd place with wind speed.
- Wind Speed – Ties for 2nd place with air temperature.
- Relative Humidity – Has a noticeable effect when the air is really dry or really humid.
In addition to these weather measurements, you need the height of the wind speed sensor, as well as the latitude, longitude, and elevation of the site location.
Tip: The site location of your weather station is very important. It is ideal to place your weather station in a location that is a good representation of the crop of interest. With turf grass, for example, your weather station should be surrounded by turf and located away from trees and buildings that can affect the wind and sun exposure experienced by the weather station sensors.
To get a little more technical, here’s a look at the science behind estimating the Reference Evapotranspiration:
ASCE Standardized Reference Evapotranspiration Equation
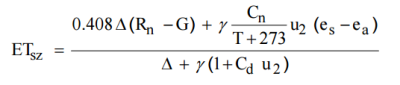
where:
| ETSZ | = standardized reference crop evapotranspiration for short (ETos) or tall (ETrs) surfaces (mm d-1 for daily time steps or mm h-1 for hourly time steps), |
| Rn | = calculated net radiation at the crop surface (MJ m-2 d-1 for daily time steps or MJ m-2 h-1 for hourly time steps), |
| G | = soil heat flux density at the soil surface (MJ m-2 d-1 for daily time steps or MJ m-2 h-1 for hourly time steps), |
| T | = mean daily or hourly air temperature at 1.5 to 2.5-m height (°C), |
| u2 | = mean daily or hourly wind speed at 2-m height (m s-1), |
| es | = saturation vapor pressure at 1.5 to 2.5-m height (kPa), calculated for daily time steps as the average of saturation vapor pressure at maximum and minimum air temperature, |
| ea | = mean actual vapor pressure at 1.5 to 2.5-m height (kPa), |
| Δ | = slope of the saturation vapor pressure-temperature curve (kPa °C-1), |
| γ | = psychrometric constant (kPa °C-1), |
| Cn | = numerator constant that changes with reference type and calculation time step (K mm s3 Mg-1 d-1 or K mm s3 Mg-1 h-1) and |
| Cd | = denominator constant that changes with reference type and calculation time step (s m-1). |
Units for the 0.408 coefficient are m2 mm MJ-1.
Example of Weather Data for One Day and the ET Value Calculated
| Time Stamp | Average Solar W/M2 | Average AirTempF | Average AirRH | Average WindMPH | ET in Inches |
|
9:00 AM |
463.9 |
65.59 |
51.83 |
5.2 |
0.01 |
|
10:00 AM |
394.2 |
67.82 |
51.08 |
3.64 |
0.01 |
|
11:00 AM |
468.1 |
70.92 |
46.21 |
2.9 |
0.01 |
|
12:00 PM |
880 |
76.89 |
38.74 |
2.75 |
0.02 |
|
1:00 PM |
940 |
82.49 |
32.01 |
2.47 |
0.03 |
|
2:00 PM |
856 |
85.98 |
21.9 |
4.52 |
0.03 |
|
3:00 PM |
813 |
88.27 |
15.68 |
3.2 |
0.03 |
|
4:00 PM |
693.1 |
88.99 |
14.89 |
4.61 |
0.02 |
|
5:00 PM |
532.9 |
89.02 |
15.38 |
4.26 |
0.02 |
|
6:00 PM |
370.8 |
89.96 |
15.31 |
2.71 |
0.01 |
|
7:00 PM |
192.8 |
88.54 |
18.72 |
2.27 |
0.01 |
|
8:00 PM |
36.53 |
82.71 |
23.88 |
4.25 |
0 |
|
9:00 PM |
0.18 |
82.29 |
15.15 |
6.88 |
0 |
|
10:00 PM |
0 |
79.14 |
21.33 |
5.69 |
0 |
|
11:00 PM |
0 |
77.81 |
21.66 |
2.81 |
0 |
|
12:00 AM |
0 |
71.13 |
34.35 |
8.71 |
0 |
|
1:00 AM |
0 |
66.94 |
40.53 |
12.69 |
0 |
|
2:00 AM |
0 |
63.79 |
47.4 |
8.22 |
0 |
|
3:00 AM |
0 |
61.34 |
52.9 |
3.21 |
0 |
|
4:00 AM |
0 |
58.66 |
59.1 |
1.88 |
0 |
|
5:00 AM |
0.86 |
55.9 |
65.98 |
2.09 |
0 |
|
6:00 AM |
43.35 |
55.2 |
68.56 |
1.45 |
0 |
|
7:00 AM |
214.1 |
60.3 |
59.44 |
3.42 |
0.01 |
|
8:00 AM |
393.5 |
64.08 |
52.49 |
3.7 |
0.01 |
|
Total ET |
0.22 |
||||
Using the ET to Adjust Irrigation Schedules
There are some smart irrigation controllers that can be used to automatically adjust the irrigation schedule based on the ET. The best controllers use accurate local weather information to produce the ET value to be used for irrigation scheduling. One example is the Weather Reach Controller Link.
I hope this information has helped you understand the basics of ET. If you have comments or questions, feel free to share them.


About the Author
 Bruce Smith is a Technical Support Specialist at Campbell Scientific, Inc. He provides technical support for many Campbell Scientific products and specializes in supporting weather stations used in the commercial irrigation industry. Bruce’s background is in building maintenance. Away from work, he enjoys spending time with his family and dogs, being outdoors, and tinkering with cars.
Comments
Robin D | 06/08/2017 at 02:45 PM
This blog article was updated to include example data for calculated ET.
Martin Vontobel | 04/06/2020 at 06:01 PM
Dear Mr. Smith
I am a student from ETH Zurich writing my Bachelor's thesis about groundwater recharge in the area of Central Switzerland.
Working with the Penman-Monteith model as described in FAO paper 56 I have a question that came up recently. Maybe you can help me?
I have meteo data with a resolution of 15 min that I feed into the PM-model but for some reason the calculated clear-sky solar radiation Rs0 (MJ/(m2*h) is always smaller than the on-site measured incoming solar radiation Rs (MJ/(m2*h). For the 15 min resolution I set the parameter tl = 0.25 according to the FAO paper.
I am not so sure whether this is correct, since with tl = 1.0 the results look much more promising.
Is it correct to set the parameter tl = 0.25 for the 15 min resolution?
Many thanks for your help and kind regards,
Martin Vontobel
ET | 04/21/2020 at 10:02 AM
If the solar radiation sensor is not level, or out of calibration, higher measured solar radiation values compared to the calculated Rso are possible. Lower measured solar radiation values compared to the calculated Rso are possible with a dirty solar radiation sensor lens, sensor not level, or sensor out of calibration.
When using the CRBasic ETsz measurement instruction, Rso for clear sky solar radiation is calculated based on hourly MJ/m² values.
It recommended to use the ETsz instruction only inside hourly data tables.
Contact Campbell Scientific support for more in depth discussion regarding FAO 56.
Please log in or register to comment.